
Data-Driven Layout
CodePup AI analyzes your dataset and generates a dashboard layout with charts, KPIs, tables, and filters that best fit the data.
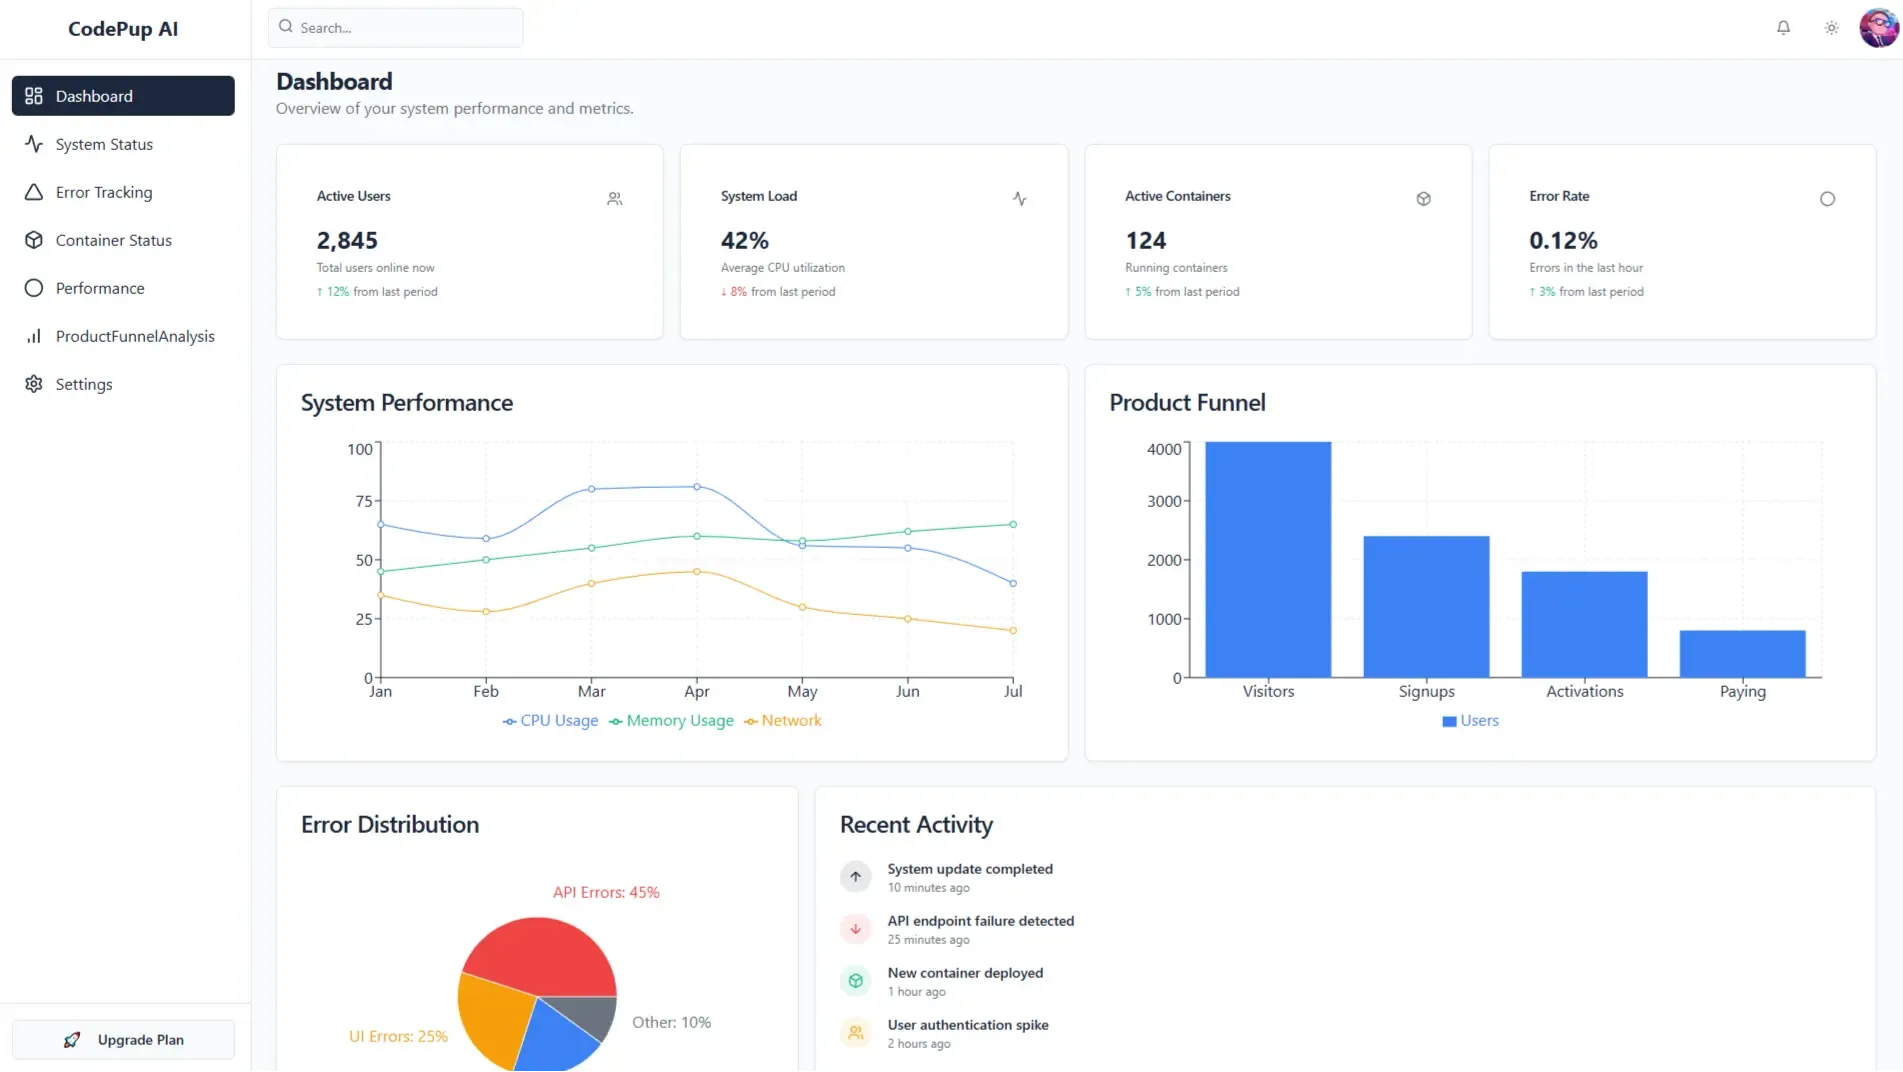
The Visualization Dashboard feature allows CodePup AI to instantly convert your uploaded CSV and Excel files into a complete, interactive dashboard.
This makes data analysis accessible to everyone. No manual charting, configuration, or coding required.
Data-Driven Layout
CodePup AI analyzes your dataset and generates a dashboard layout with charts, KPIs, tables, and filters that best fit the data.
Multiple Chart Types
Depending on your dataset, CodePup AI may create bar charts, line charts, pie charts, metric cards, or combined views.
Automatic Filtering
Filters such as date ranges, category selectors, search fields, and numerical sliders are created automatically.
You can upload:
.csv.xlsx.xlsAll filtered results inside the dashboard can be exported.
Useful for analytics teams, client reporting, and internal tools.
E-commerce Analytics
Upload your order data to instantly visualize sales trends, revenue breakdowns, and customer patterns.
Operational Dashboards
Turn raw operational logs into fully usable dashboards for internal monitoring.
Client-Facing Reports
Create clean, presentable dashboards for reports without manual chart creation.
The Visualization Dashboard helps teams and creators move from raw data to actionable insights instantly.
CodePup AI handles the heavy lifting like parsing, cleaning, analyzing, and visualizing - so you can focus on decisions, not implementation.