
Analytics Dashboard
Codepup AI’s built in Analytics Dashboard gives you real time insights into how people are finding and using your website no third party tools, no setup required.
Track visitors, traffic sources, audience data, and live sessions all from one place.
Video Walkthrough
Section titled “Video Walkthrough”Watch the full Analytics Dashboard walkthrough to see everything in action:
Why Use Analytics?
Section titled “Why Use Analytics?”With Codepup AI Analytics you can:
- Monitor how many people are visiting your site
- See where your traffic is coming from
- Understand your audience (devices, locations, browsers)
- Watch live sessions to see real user behavior
- Make smarter decisions to grow your project
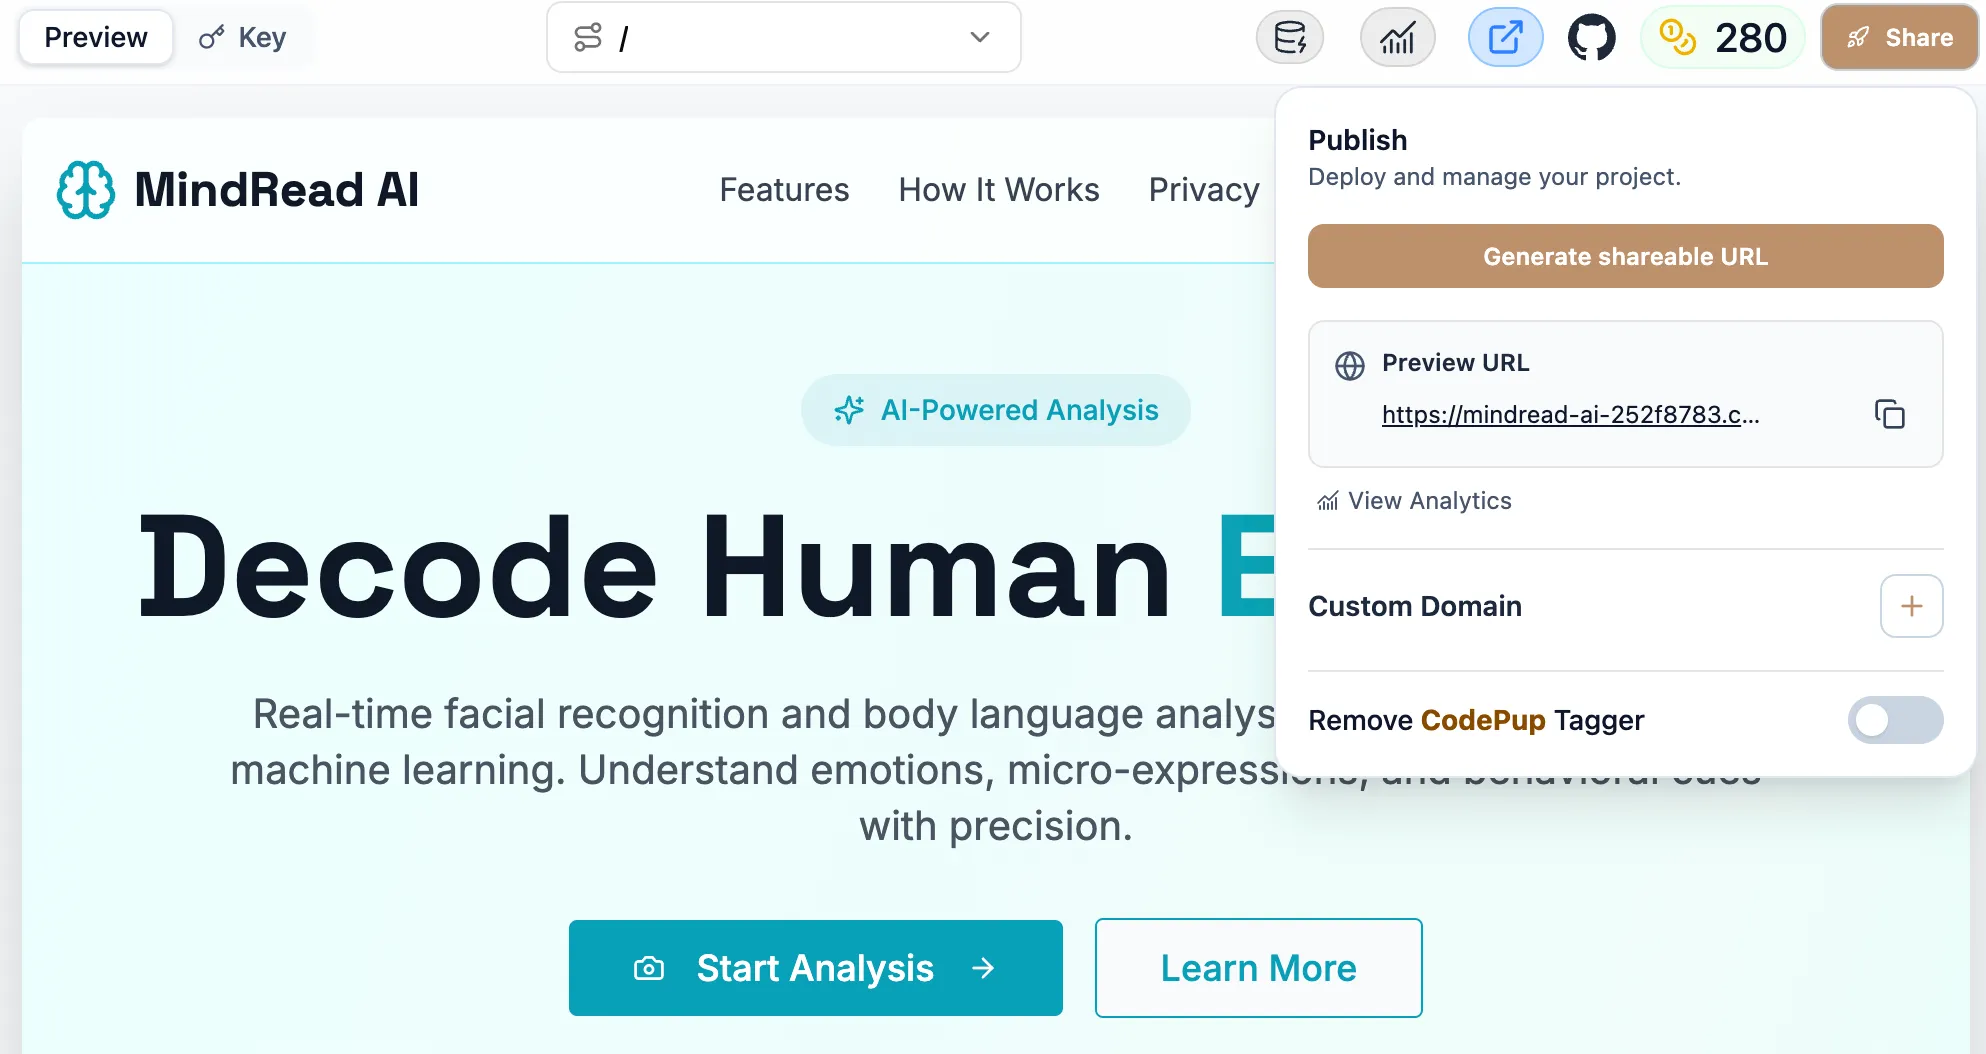
How to Open Analytics
Section titled “How to Open Analytics”- Open your Codepup AI project
- Click the 📊 Analytics icon in the top toolbar
- The Analytics Dashboard will open
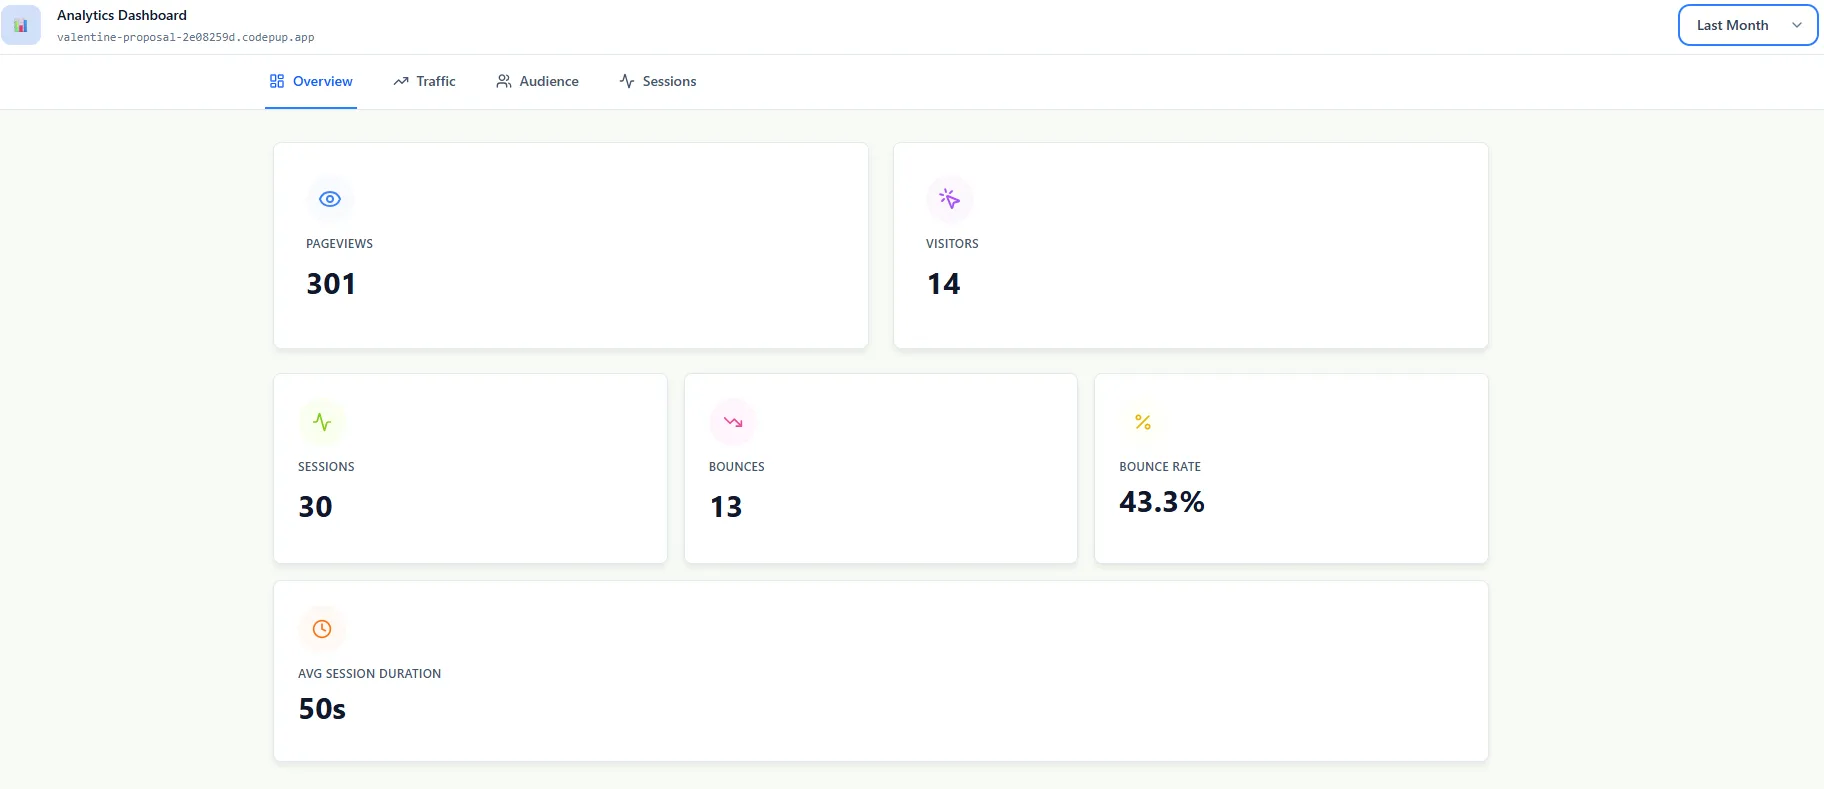
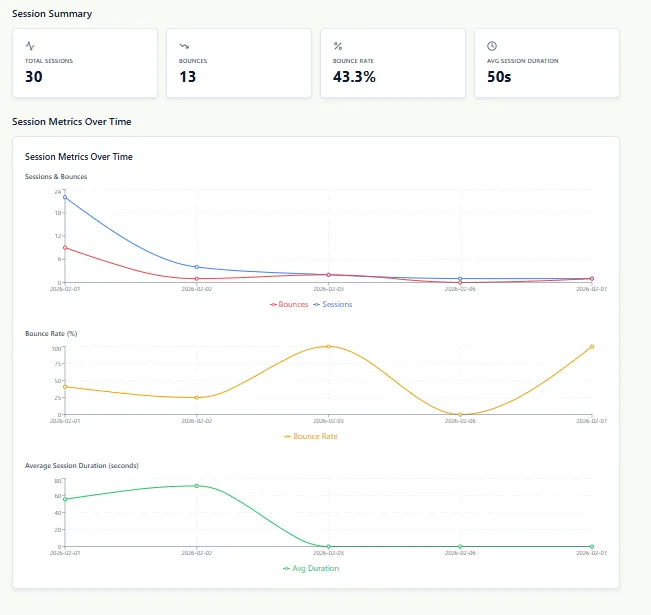
Dashboard Overview
Section titled “Dashboard Overview”The Overview tab gives you a quick snapshot of your performance.
It includes:
- Total pageviews
- Visitors
- Sessions
- Bounce rate
- Average session duration
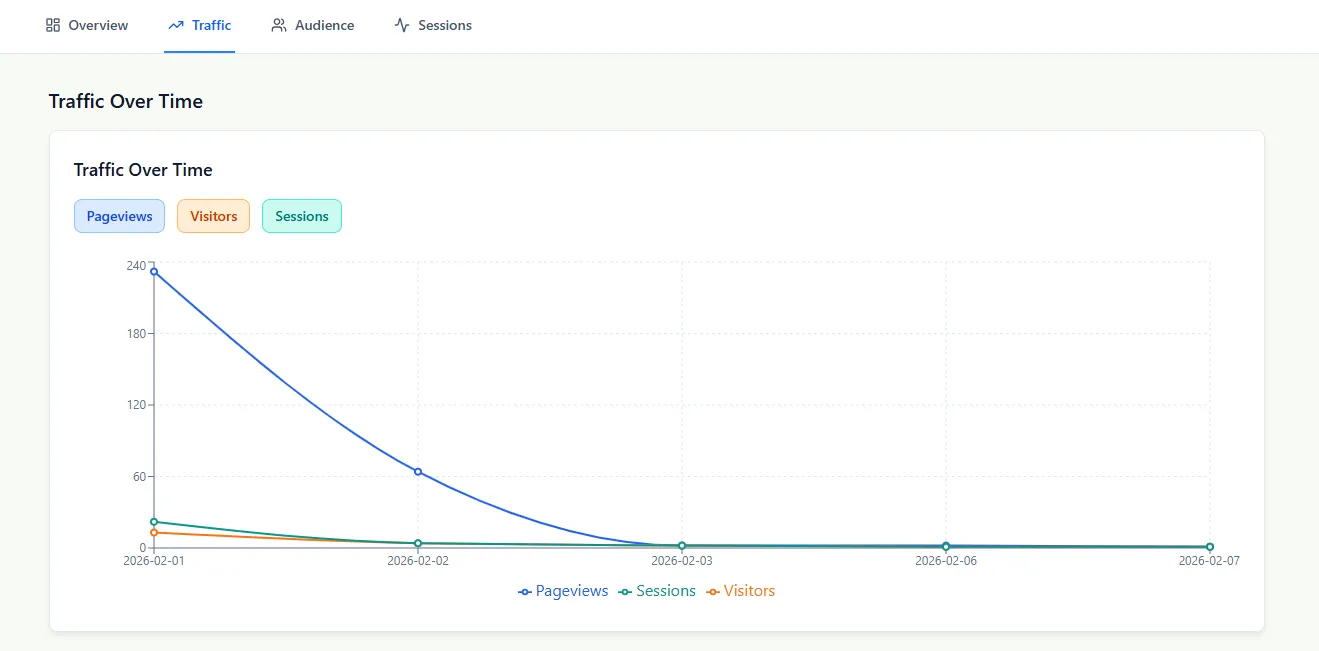
Traffic Insights
Section titled “Traffic Insights”The Traffic tab shows how your visitors change over time.
You can track:
- Pageviews
- Visitors
- Sessions
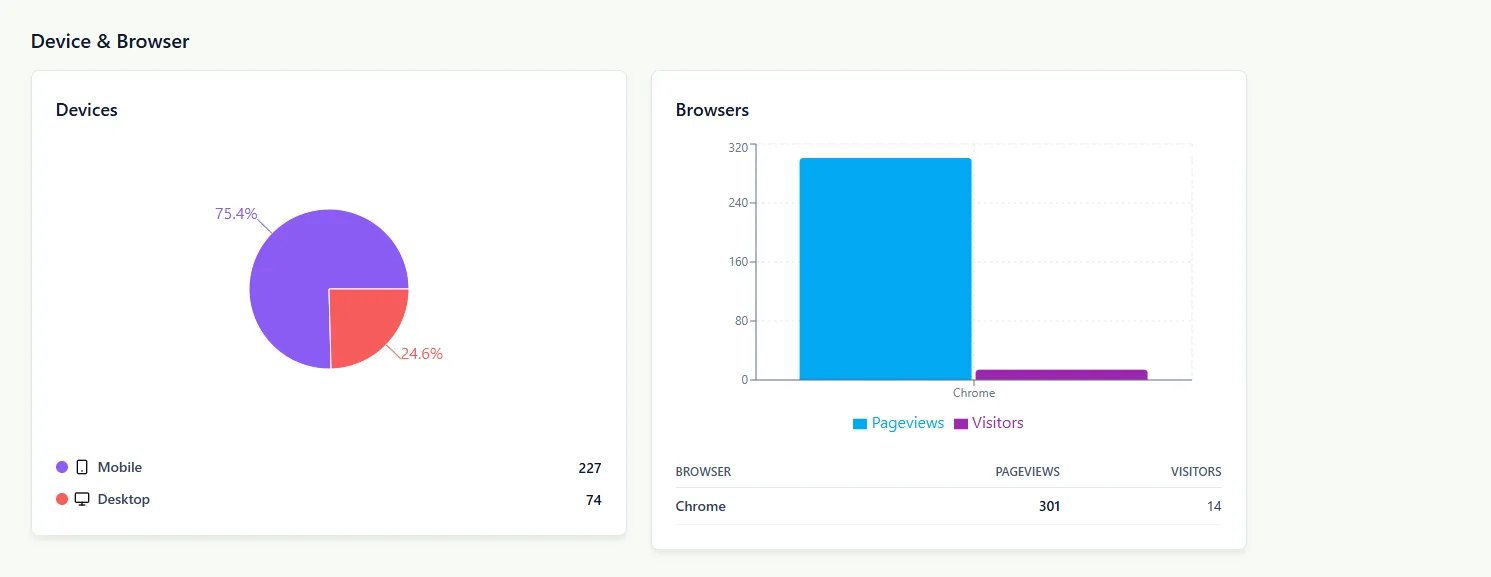
Audience Insights
Section titled “Audience Insights”The Audience tab helps you understand your users.
It shows:
- Device breakdown (mobile vs desktop)
- Browser usage
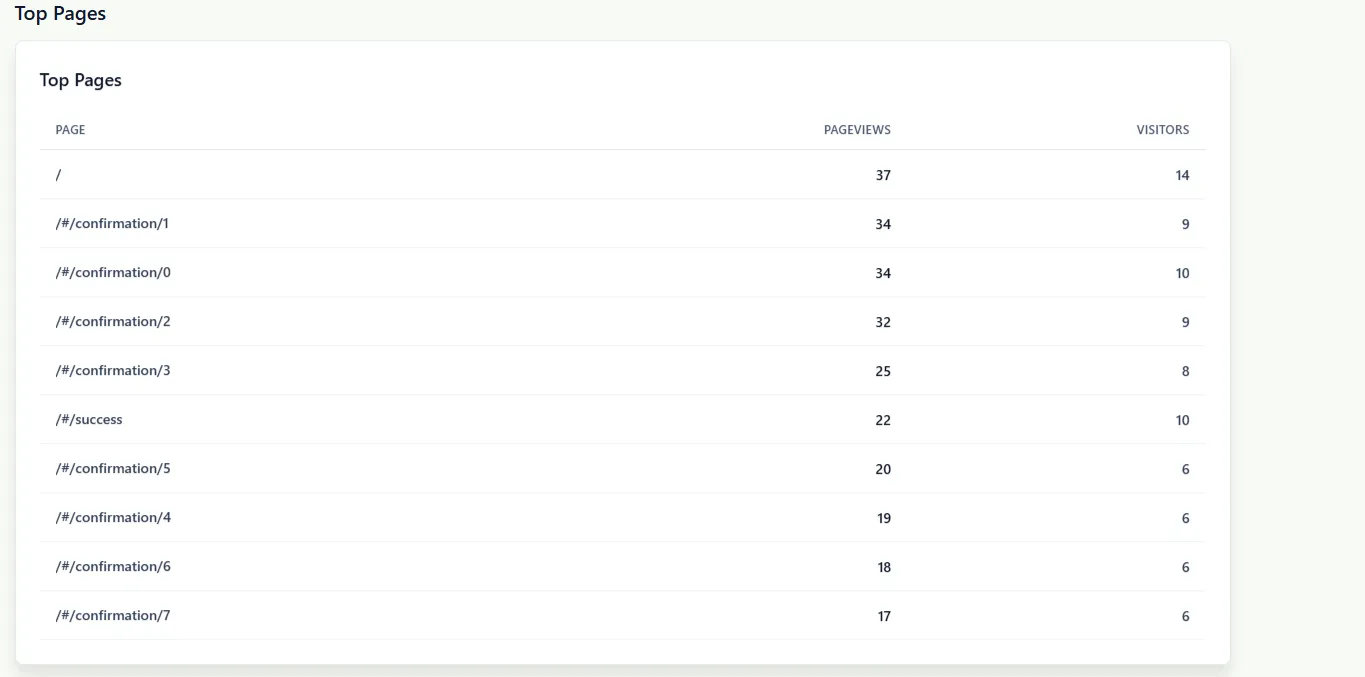
Top Pages
Section titled “Top Pages”See which pages are performing the best.
This includes:
- Most visited pages
- Pageviews per page
- Visitor count per page
Sessions
Section titled “Sessions”The Sessions tab shows individual user journeys.
You can see:
- Entry page
- Pages visited
- Session duration
- User device and location
Best Practices
Section titled “Best Practices”If your analytics are not loading or showing unexpected data:
- Use the in-app support chat
- Check the FAQ in the documentation
Know your audience, grow your project 🐶📊